[Post 3] Goalie Performance: Adjusting for Age
In the first post, I outlined a framework to measure goalie performance using their career 5v5 Fenwick save percentage and empirical Bayes. In the second post, I refined the methodology to consider shot quality. The outstanding assumptions are included below.
Assumptions: - Age is assumed to be irrelevant. - The prior distribution is assumed to be beta with hyperparameters 852 and 55.6. - Goalies facing less than 200 shots are ignored. - Goalie careers are equal. - Scoring rates are assumed to be constant. - Team systems are assumed to be identical.
In this post, I'm going to address the effect of age on goalie performance.
Outline
Like shot quality, the effect of age on performance is a well-researched concept. It has been shown that goalies tend to improve as they age, peak, and then recede for, well, forever. This concept is typically called an age curve. Though goalie age curves are already available elsewhere, they differ slightly, so I'm going to define a custom age curve based on the Moneypuck dataset. Here are the steps:- Obtain goalie birth dates. - Derive goalie age for each game. - Define new analysis population (we won't find every goalie's date of birth). - Explore age. - Adjust for age.
Obtain goalie birth dates
I scraped hockey-reference for each goalie’s date of birth (code available here). By combining the goalies’ birth dates with the dates of each of their games, I determined their exact age for every game played. </p>
The analysis population changes as follows (due to incomplete linkage): - Goalie population drops from 315 to 308. - Harmonic mean of shots against rises from 12,690 to 12,721 (mean rises, 4,198 to 4,286). - Harmonic mean of AdjSV% stays at .939 (mean rises, .932 to .933).
They barely differ.
Explore age
Let's start by simply grouping shots into bins by goalie age (rounded to the first decimal, ex: 26.0, 26.1, etc.), and then calculating the group-wide save percentage. Here's what that looks like, with points becoming paler for smaller groups sizes:
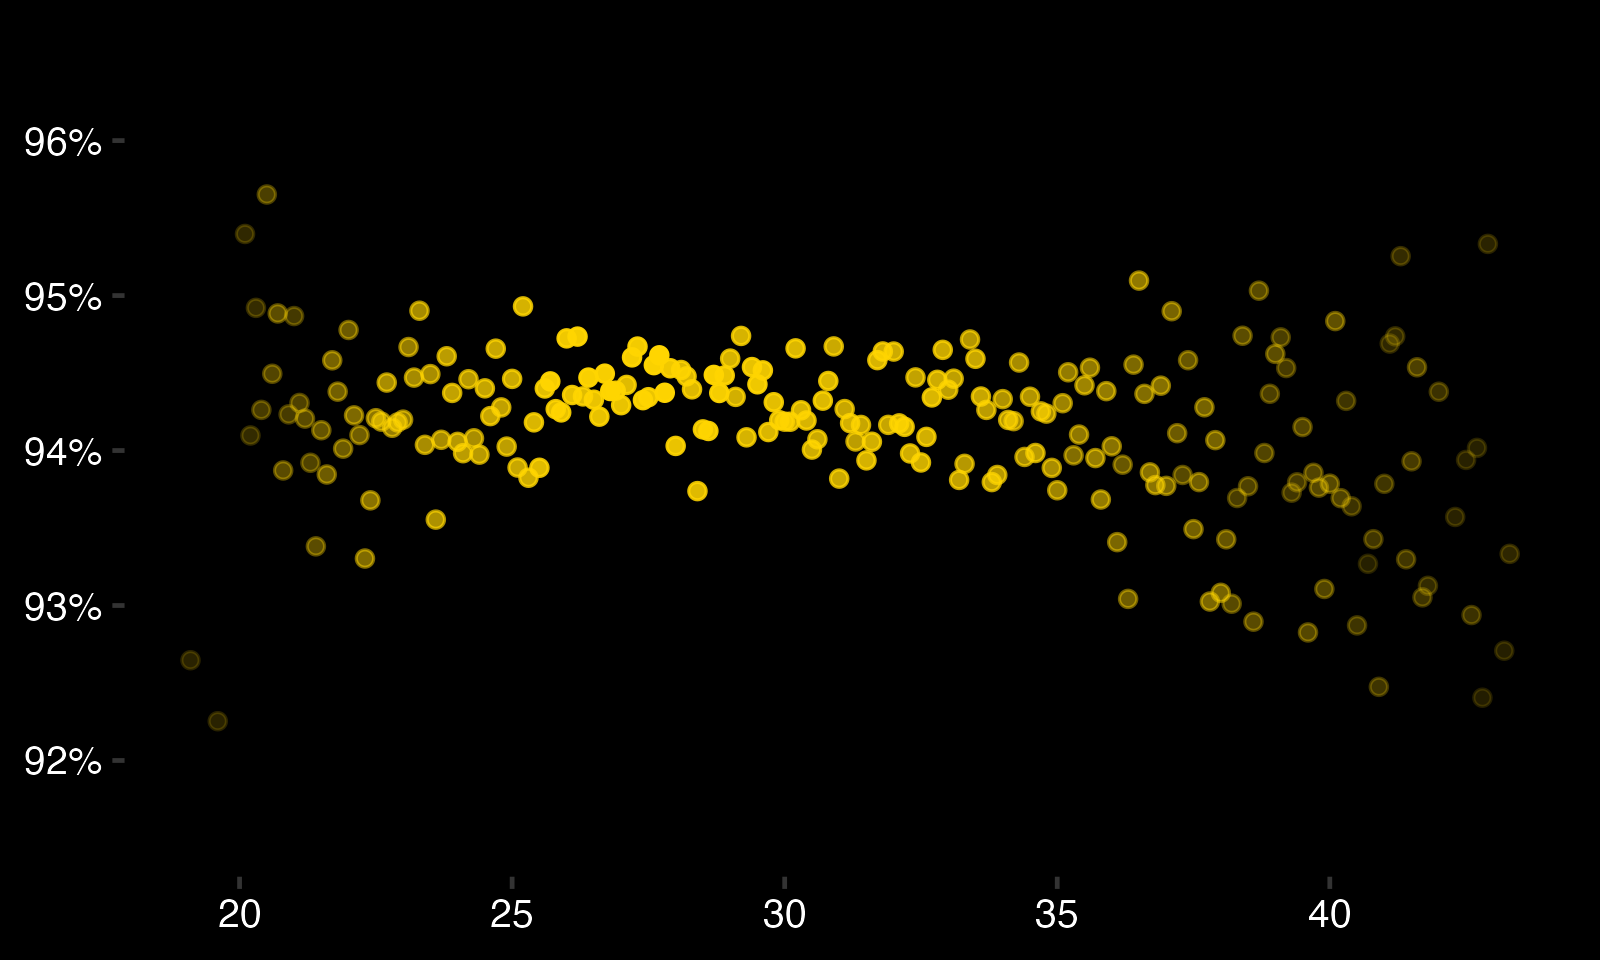
Some thoughts: - Most shots are taken on goalies aged 23-35. - If you squint, you can see a little bit of an age curve here. - This plot is riddled with bias (particularly for goalies with short or long careers).
Let's fix some of the bias above with a few changes. We'll follow a well-worn strategy seemingly developed by Tango Tiger here called the delta method.
Here are the steps: - Take change in save percentage (dSV%) from each goalie's age to the next. - Take the harmonic mean of dSV% for each age as the the observed change in SV%. - Clip off underrepresented ages (-21, 39+). - Clip off the final year of each goalie's career. - Take the cumulative sum of dSV% throughout the retained age range.
Altogether, this gives us the curve below:
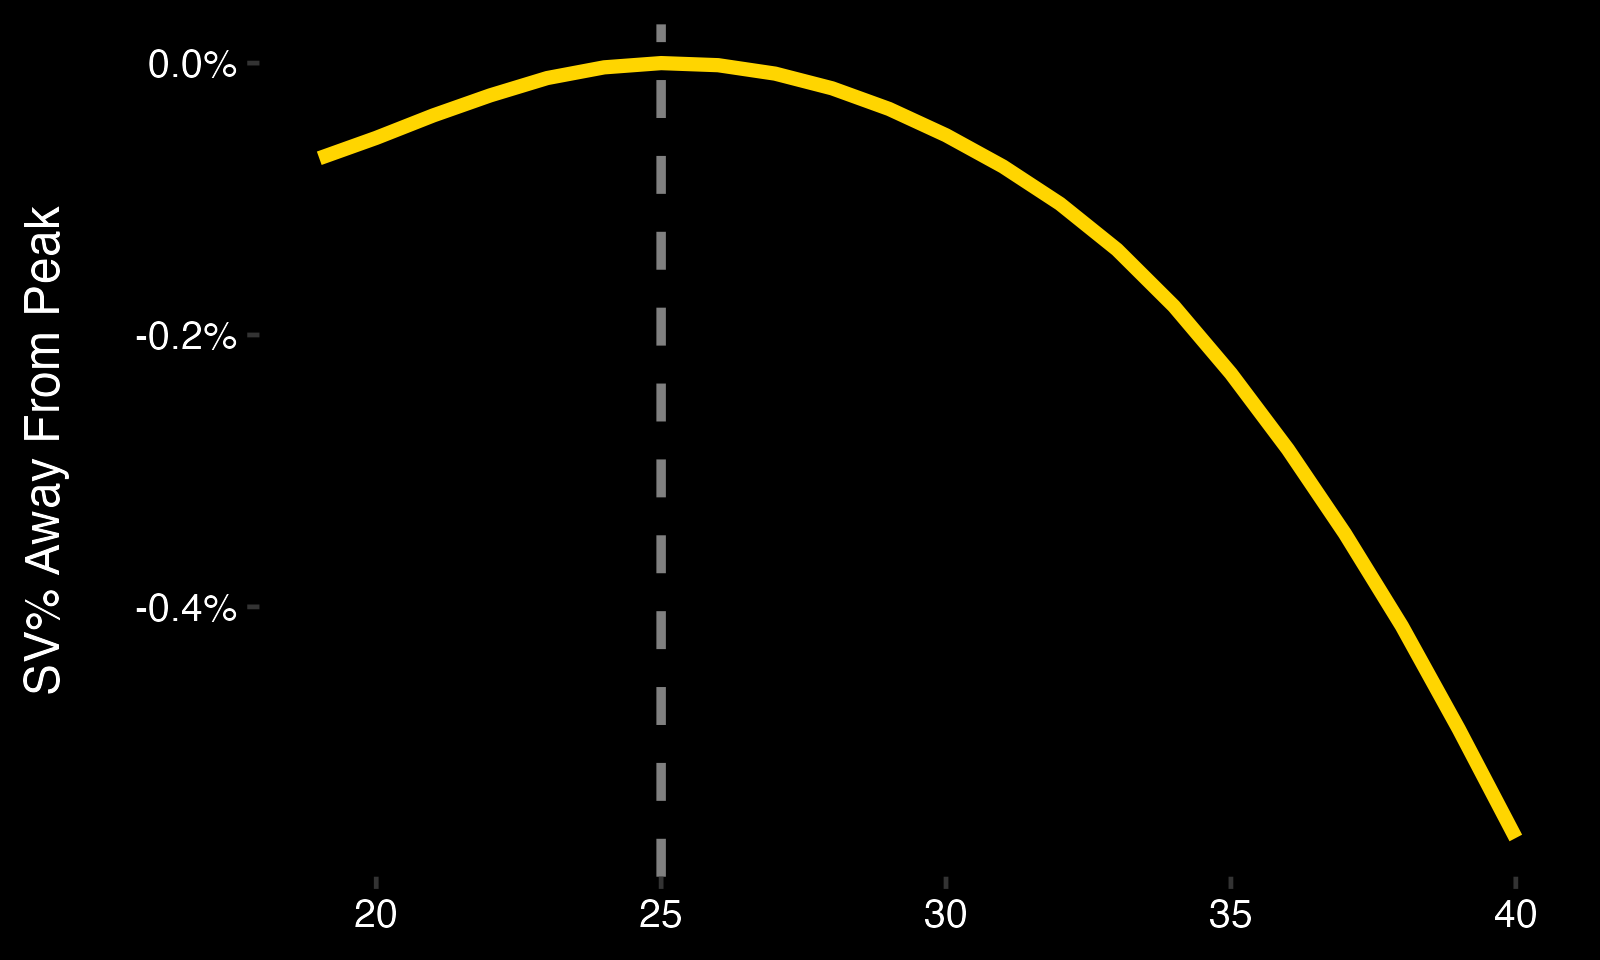
Some thoughts: - With this method, goalies peak around the age of 25. - This agrees with some past research. - This disagrees with other past research.
Adjusting for Age
The cleanest way that I can think of adjusting for age is to bake it into the current framework which already adjusts shots by their probability of becoming a goal. This can easily by done by first setting the peak (age 25) as the standard and then adjusting for all other ages, so that, for example, an xFSV% of 0.940 at age 25 is equivalent to an xFSV% of 0.93976 at age 22 (0.94000 - 0.000237) and an xFSV% of 0.93586 at age 38 (0.94000 - 0.00414).- Adjusted (xG) Save Percentage (AdjSV%) = MSV% + (FSV% - xFSV%) - Age Curve Adjustement (acAdj) = f(age), where f is the smoothed curve in the plot above. - Adjusted (Age + xG) Save Percentage (AdjSV%) = MSV% + (FSV% - xFSV% + acAdj)
With this adjustment, Lundqvist's career save percentages work out like this: - SV%: 0.948638 - SQ AdjSV%: 0.947320 - Age SQ AdjSV%: 0.948619 - posterior SQ AdjSV%: 0.947082 - posterior Age SQ AdjSV%: 0.948338
Code available here: https://github.com/spazznolo/goalie-performance/blob/main/posts/post-3.R