Enhancing the Draft Pick Value Framework
In general the probabilities were pretty well calibrated. However, the model was too certain in the top 10 picks. As a result, the sportsbooks cooked us.
But first, a visual recap for those who don’t want to read the previous three posts (I get it). </p>
Visual Recap
1. A rank-ordered logit model was built using numerous publication rankings throughout the draft year to derive prospect pick probabilities, like this:
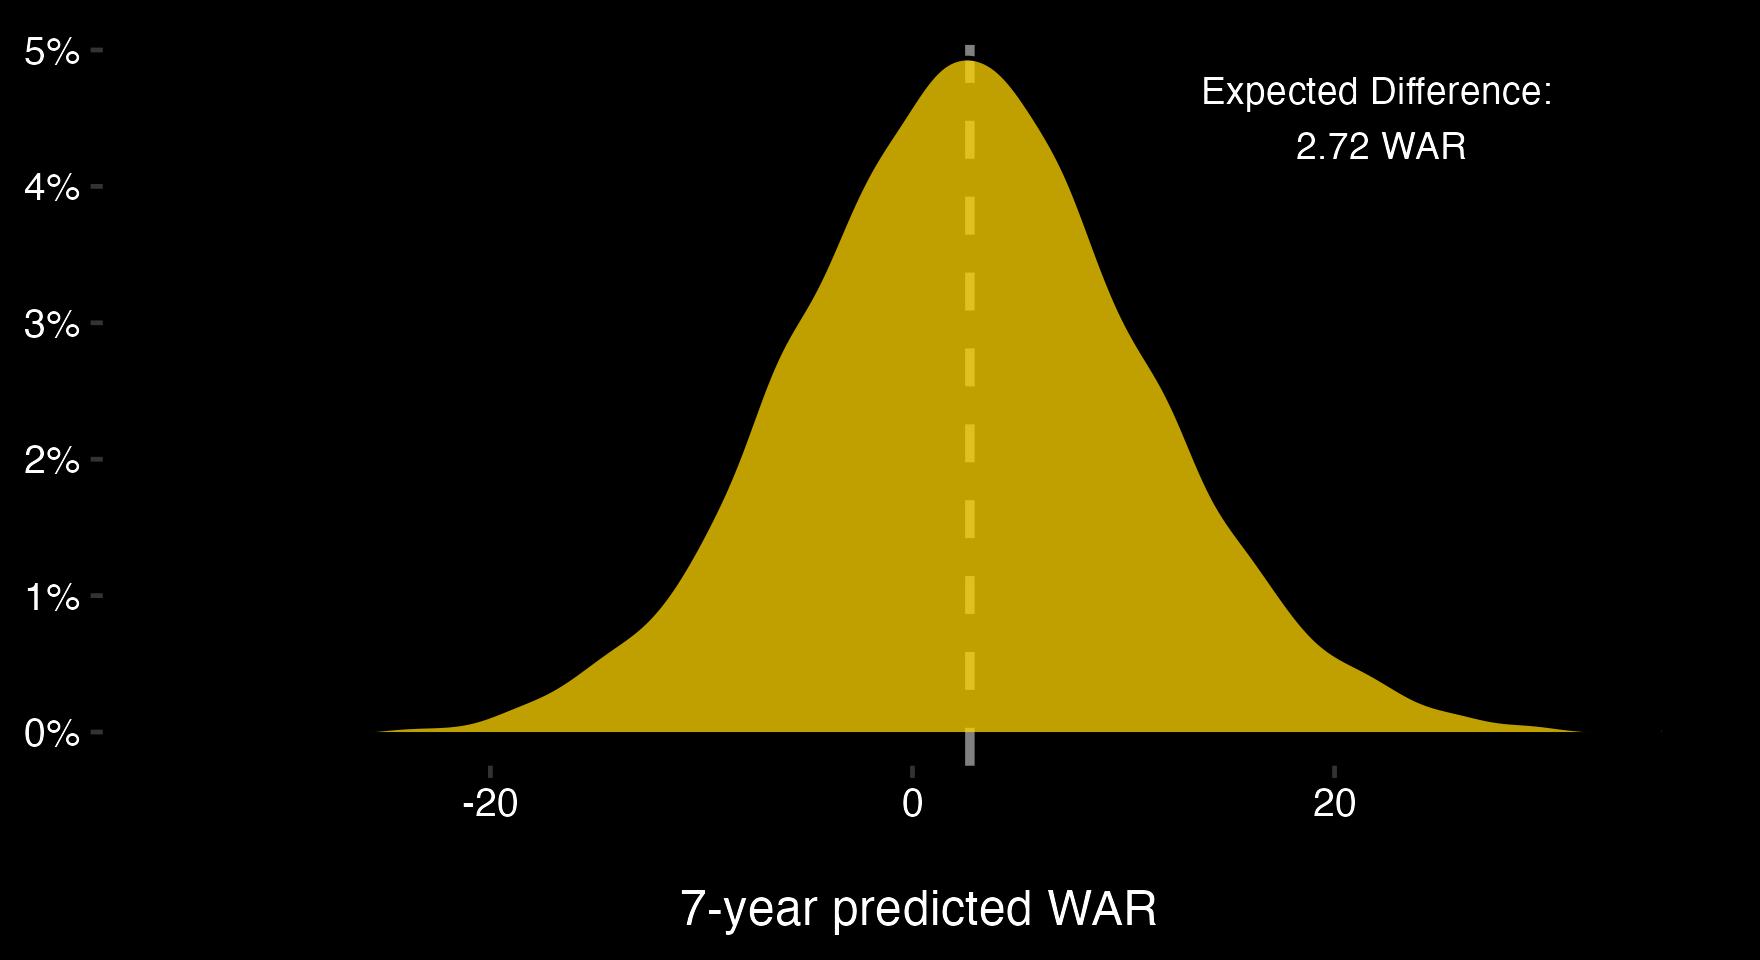
2. Prospect values were derived using a historical draft pick value chart (values are placeholders for teams' actual internal projections), along with uncertainty estimates, like this:
3. The previous two points were combined to create new pick value charts, like this:
As an example, the value of the third pick for a team who ranked the top 3 players in the draft as Bedard-Fantilli-Carlsson would be calculated as follows: - There's a 0% chance Bedard is available, so his value is multiplied by 0. - There's a 21.0% chance Fantilli is available, so his value is multiplied by 0.210. - There's a 79% that neither Bedard nor Fantilli is available, so Carlsson's value is multiplied by 0.790. - These three values are summed to get the third pick's value.