[Post 2] Goalie Consistency: The inter-game effect on expected standing points
Here’s an illustration: Imagine you’re the General Manager of a hockey team in a league where every single skater and goalie is equally skilled. Since all players are equal, all teams are equal too. Now, a special opportunity comes up where you get to decide between five equally skilled goalies who have different levels of consistency.
Goalie A always plays average, no matter what. Goalie B plays half his games slightly above average, and the other half slightly below average. Goalie C plays half his games a little better than B’s good games, and the other half a little worse than B’s bad games. And so on...
Which do you want to play for you?
To help in this decision, let's run simulations. A set of random Poisson are generated, where the expected quality of play is represented by the Poisson’s expected rate of occurrences, such that in an average game, a goalie is expected to allow around 3 goals; in a slightly below average game around 3.25 goals; below average around 3.50, and so on…
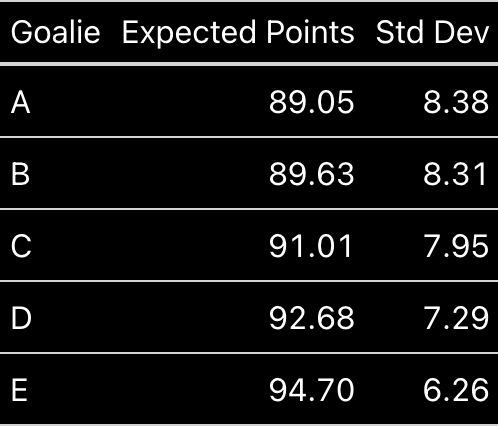
Running 10,000 simulations of 82 game seasons yields the following expected standings point distributions.
 |
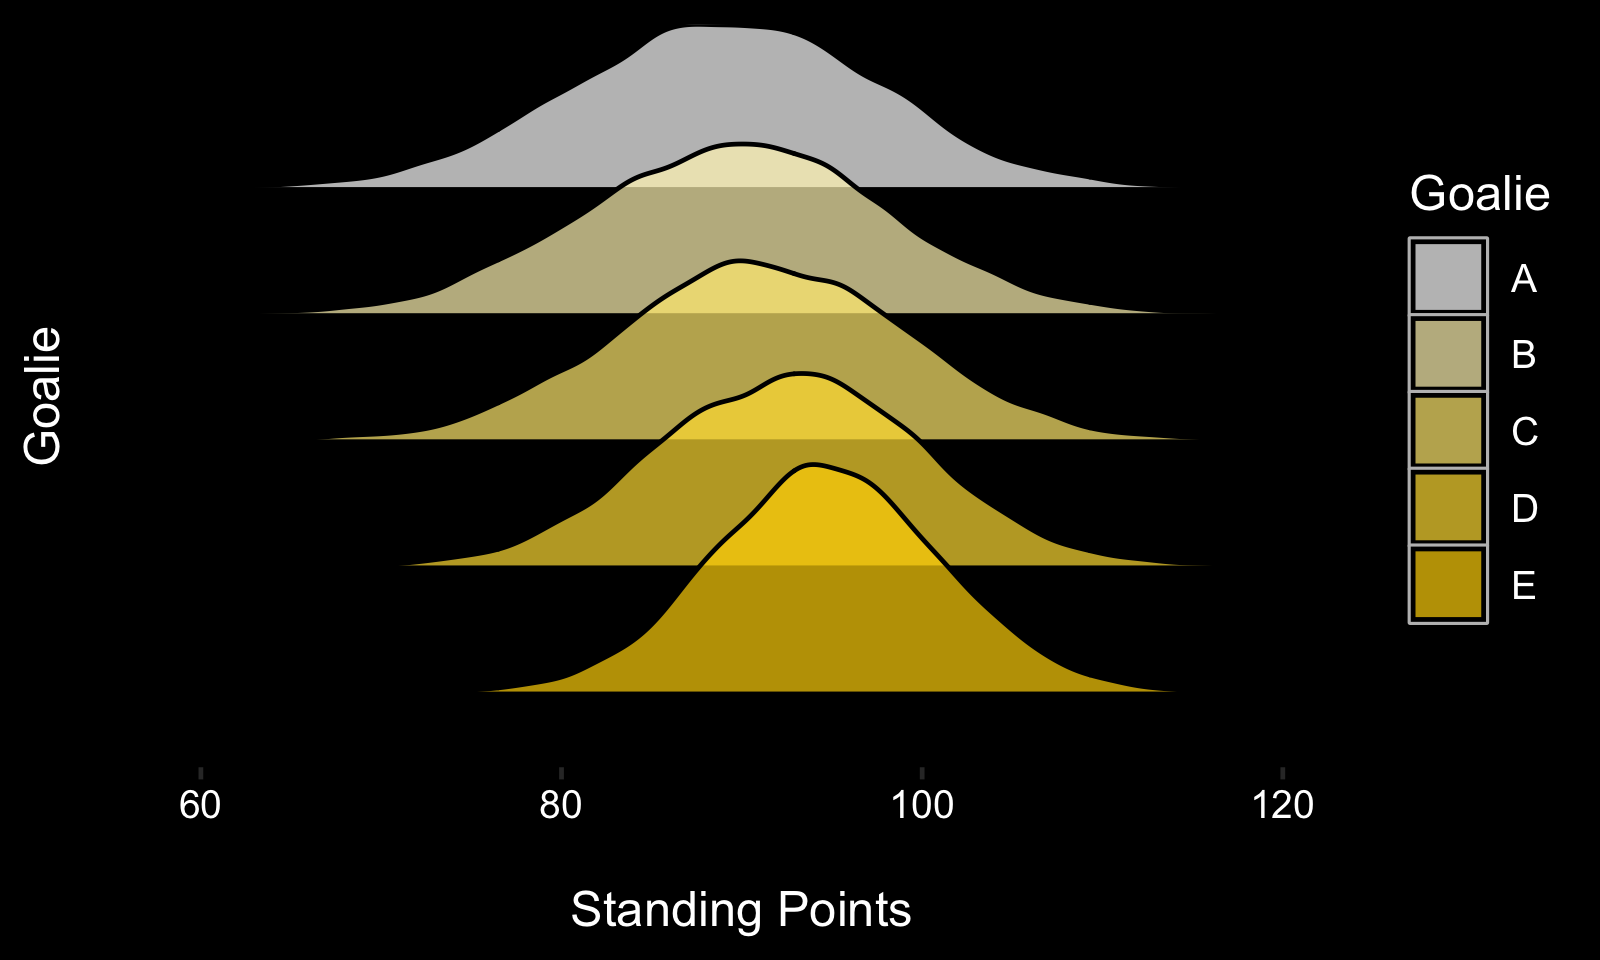 |
It turns out the average expected standing points increases as a goalie’s inter-game consistency decreases. If that’s surprising to you, you’re not alone - it is a little paradoxical.
However, if you accept that goals follow a poisson distribution (which you should!), the fact that a goalie who expects to allow 1 and 5 goals a game gets more standing points than one who is always expected to allow 3 is self-evident. It can even be eye-balled using the probability mass function of the Poisson distribution.
Still not convinced? Take the scores from past NHL seasons and look at the actual standing points % won when teams allow 0-6 goals. A team can expect higher standing points % allowing 2 and 4 goals (or 1 and 5, or 0 and 6) than it can allowing 3 goals twice.
Some other takeaways:
- The variance in expected standing points increases as a goalie’s consistency increases. This too might seem paradoxical, but actually it’s pretty simple if you think about it - a goalie who we expect to allow 1 goal some games and 5 goals the other leads to relatively certain in-game results.
- The difference in expected standing points might seem small (about 5, or 2.4 wins, over a standard 82 game season), but it could be the difference between making and missing the playoffs.
But is any of this helpful? Taken alone, not really. A goalie can’t and will never be inconsistent from game to game on purpose. It does lead to other questions though, like: are some goalies inconsistent by nature?; are they inconsistent from season-to-season as well? how about from shot-to-shot? and what is the effect of inter-shot consistency on expected standing points? This last question is addressed in the next post.
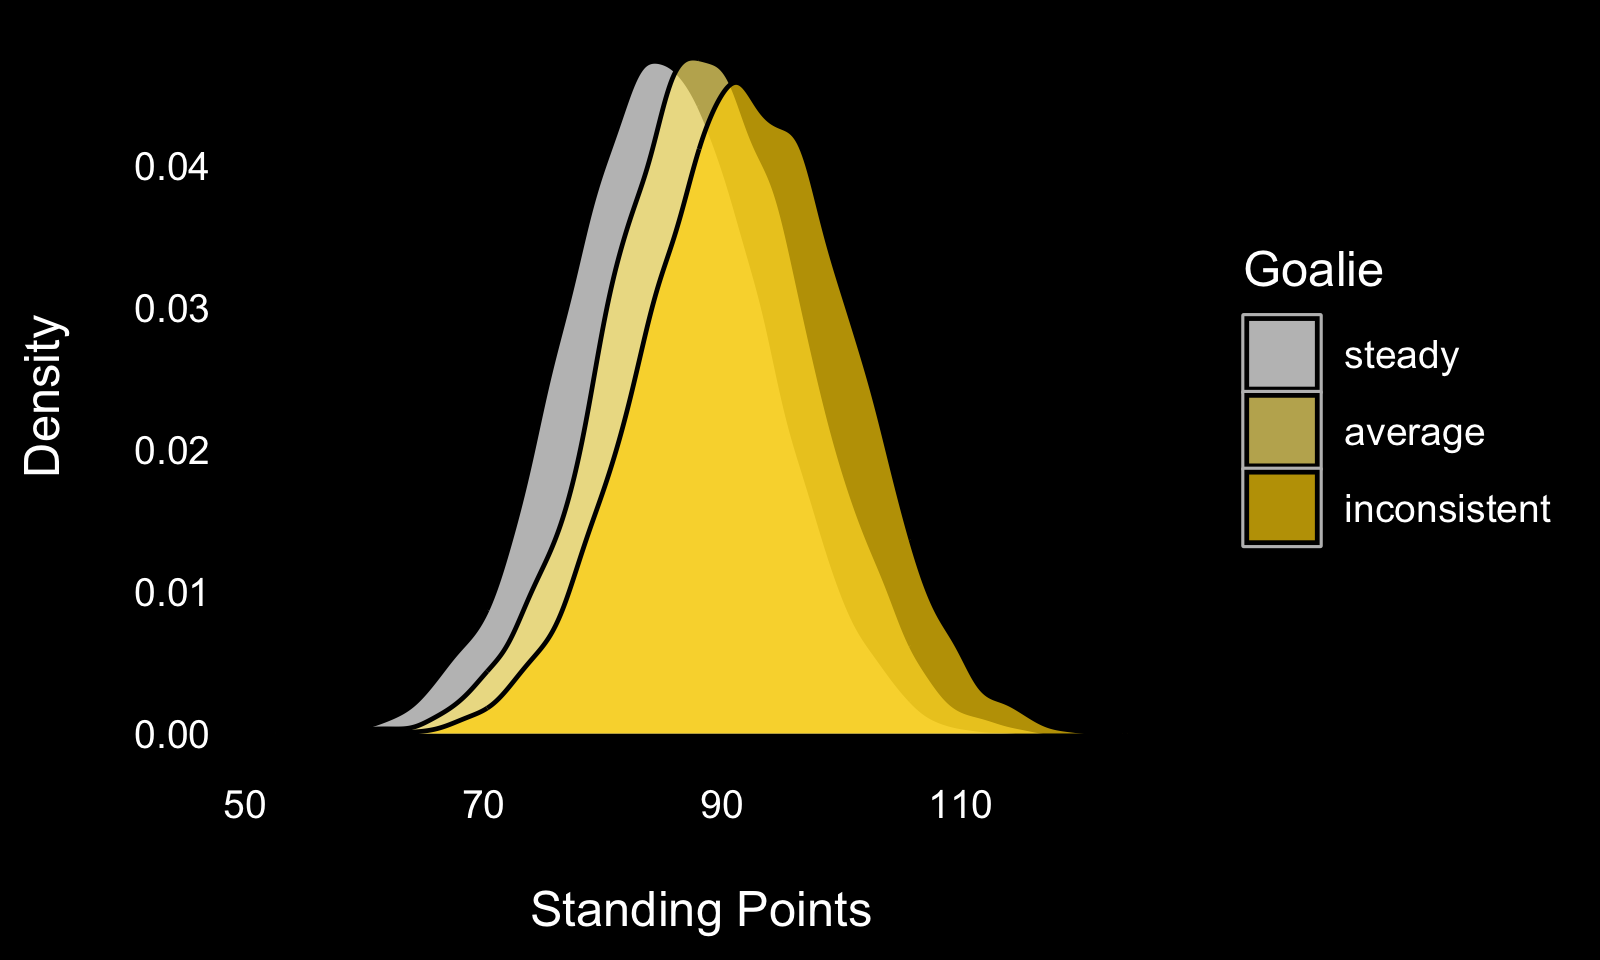
Note: For clarity’s sake, I introduced game-to-game consistency without randomness (a goalie was expected to be above average and below average in half of his games), but this also works with randomized expectations. The plot below compares the distribution of standing points when the expected rate of occurrence is randomly sampled from the uniform distribution to those when the expected rate of occurrence is the average expected goals against. The expected difference between a perfectly steady goalie and a perfectly random goalie is about 7 standing points!