[Post 5] Goalie Performance: Sample Sizes
Goalies in the analysis
Whenever we decide on a range of years for an analysis (in this case, 2007-2022), we are cutting of goalies mid-career. Some, like Carter Hart, are beginning their careers. Others, like Lundqvist, ended them during in the middle of the analysis period. Since we are not yet adjusting for age, we can't include these goalies in the analysis. Therefore, only goalies who started their careers post-2007 and ended their careers pre-2022 can be included. This is a 15 year range.The analysis population changes as follows: - Goalie population drops from 315 to 140. - Harmonic mean of shots against rises from 12,690 to 14,568 (mean drops, 4,198 to 3,225). - Harmonic mean of AdjSV% stays at .939 (mean drops, .932 to .927). - Mean of career shots faced drops from 4,198 to 3,225. - Mean of AdjSV% drops from .932 to .927.
Contextualizing Experience
Let's start simple: How long is the average goalie career? How many goalies face over 30 shots? How many make it past 200?... All of these questions can be answered by plotting the cumulative distribution function (cdf) of career shots faced for goalies.Some thoughts: - 25% of goalies faced 33 shots or less (!). - 50% of goalies faced 202 shots or less (that's about 7 games). - 75% of goalies faced 2,606 shots or less.
We can gain another perspective on goalie experience by repeating the plot above for goalie career seasons played.
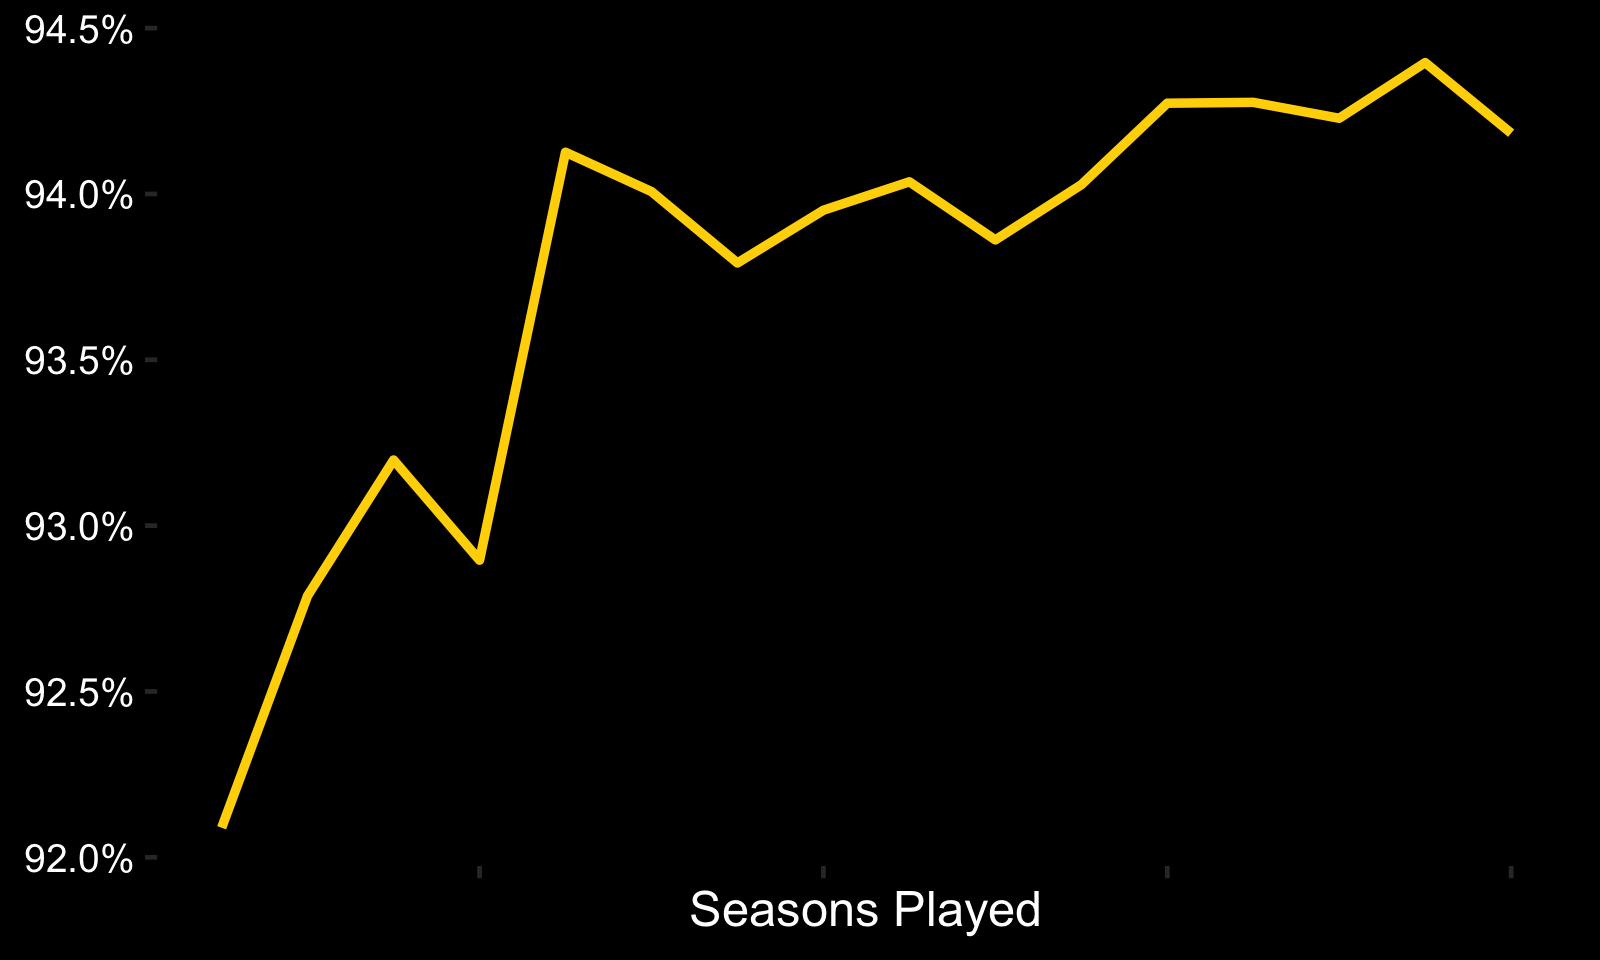
Some thoughts: - 42% of goalies played only one season. - 74% of goalies played five seasons or less. - 90% of goalies played twelve seasons or less.
It should now be obvious that most goalies don't really have a typical NHL career as we imagine them. Let's confirm the assumption that goalies with more experience perform better than those with less.
It is difficult to understand a goalie's path by looking at their save percentage or shots faced in isolation. What's nice about the empirical Bayesian method introduced in the previous posts is that it considers these measures at the same time. Moreover, we can repeatedly re-evaluate a goalie's pAdjSV% after each shot they face. We can then plot this posterior over each shot of a goalie's career to get a sense of their path. In order to extract more insight from this, let's section goalies by their career shots faced, like this:
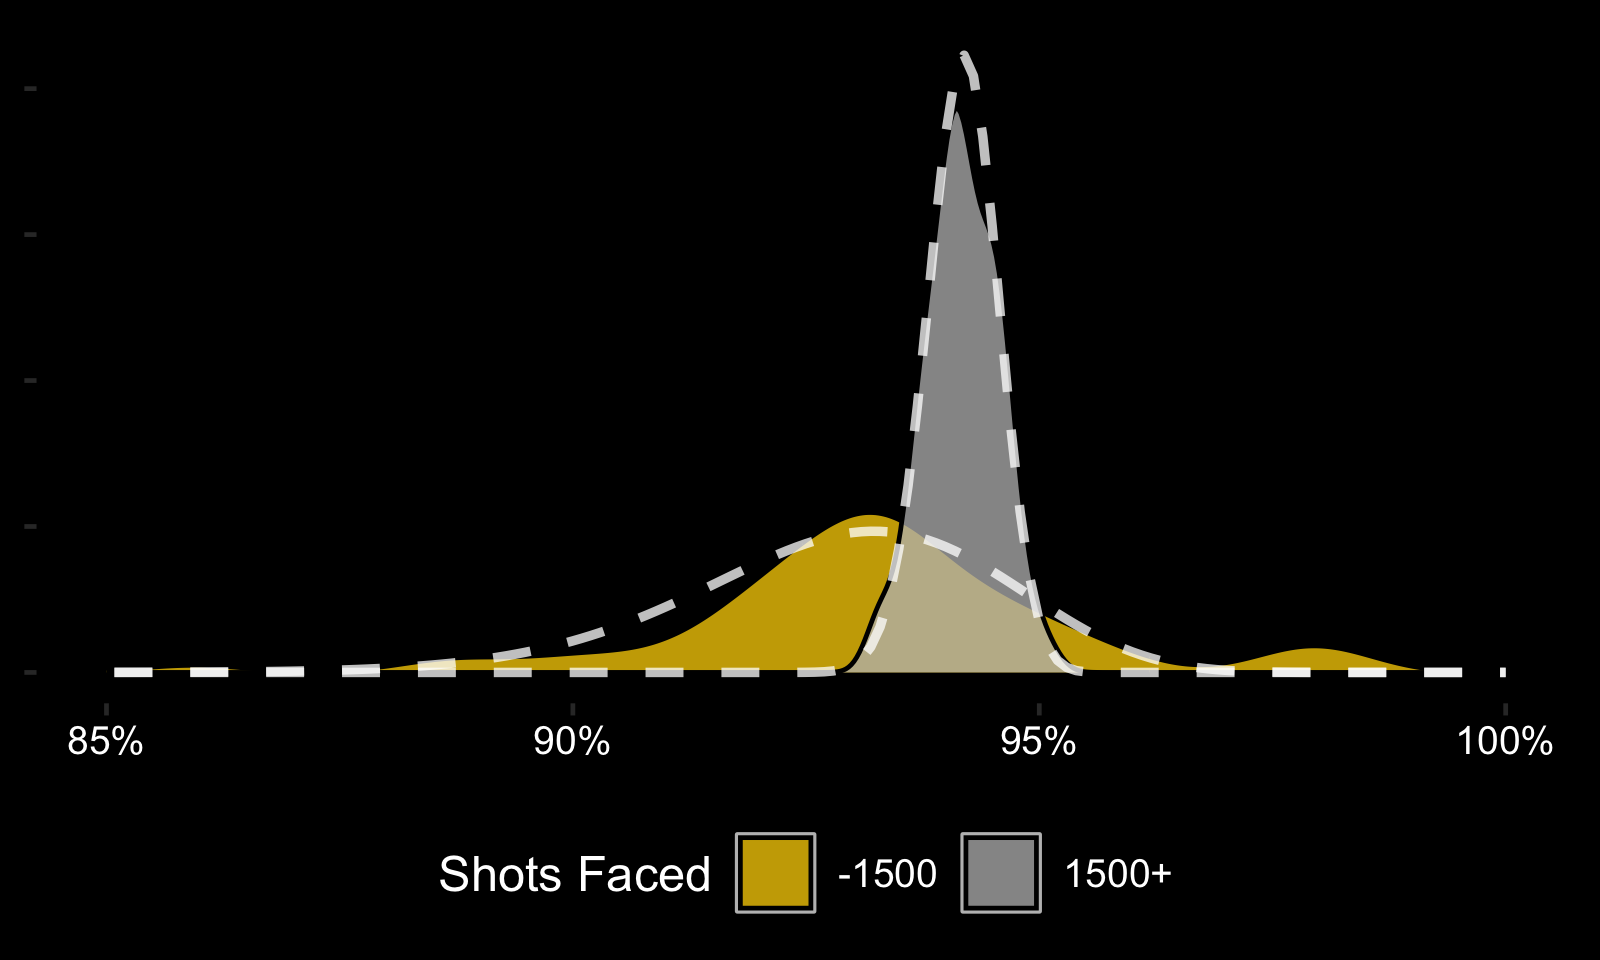
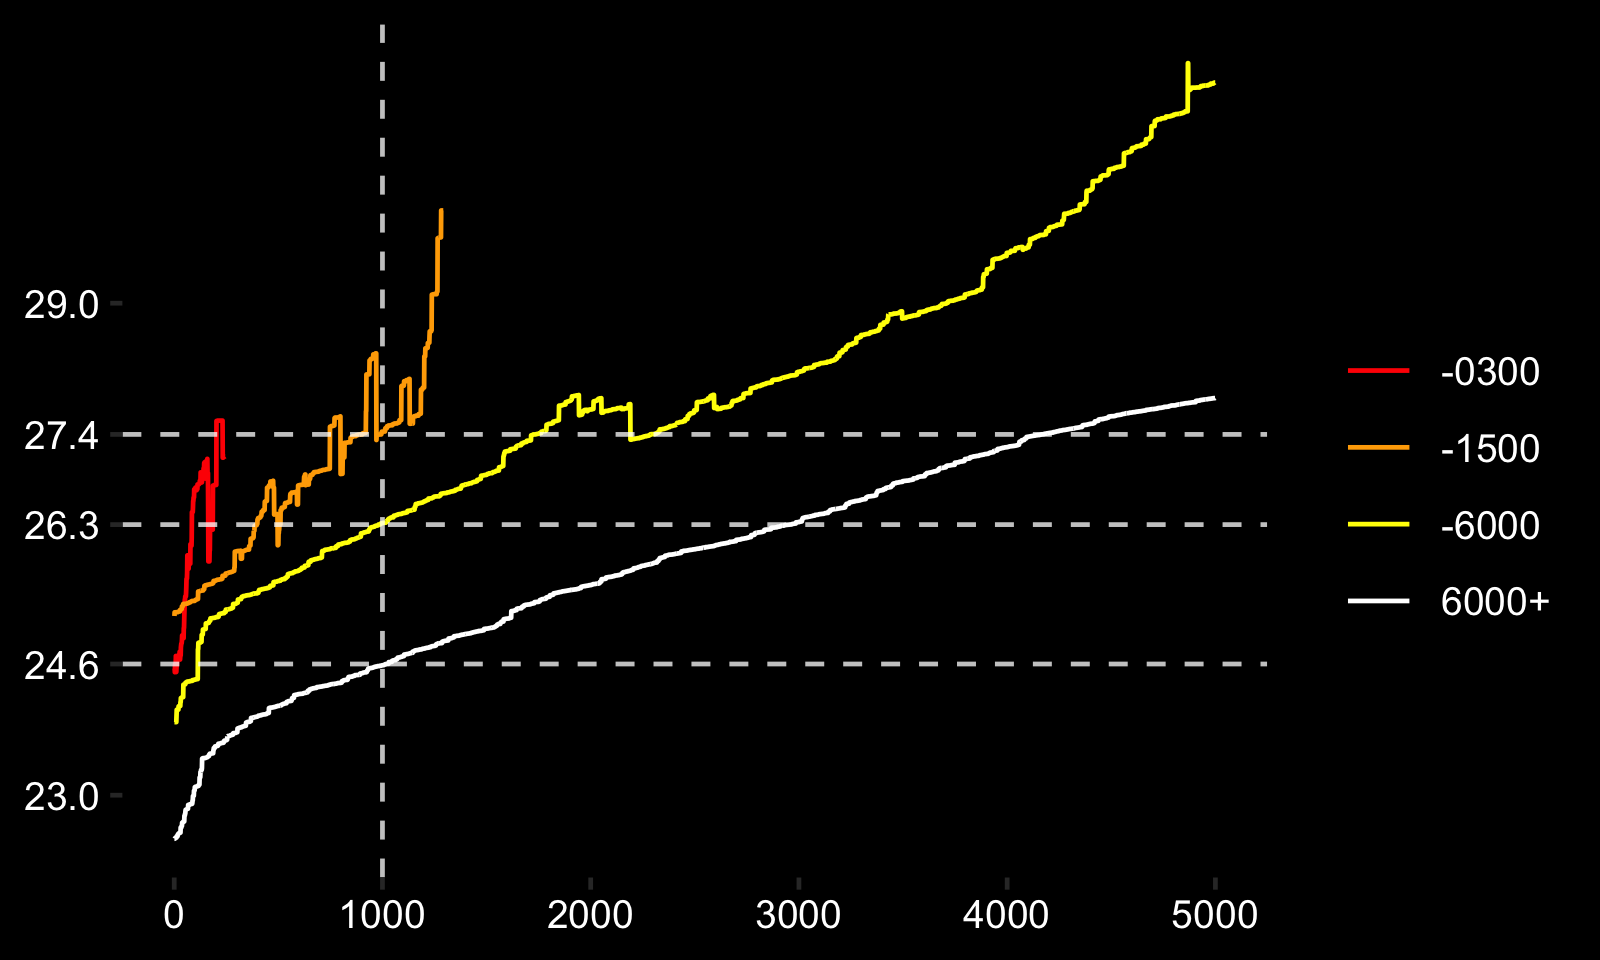
Goalies facing: - less than 300 shots -> -0300. - more than 300 shots, but less than 1,500 -> -1500. - more than 1,500 shots, but less than 6,000 -> -6000. - more than 6000 -> 6000+.
As an example, Braden Holtby's pAdjSV% after facing various shot totals: - 0 shots: 0.9417 (as is every goalie's) - 1,000 shots: 0.9421 - 5,000 shots: 0.9425 - 10,000 shots: 0.9452 - 15,000 shots: 0.9450 - 19,555 shots: 0.9433
Some thoughts: - Nearly every goalie (77.1%) who faces -6000 shots ends his career with a pAdjSV% below expected. - Goalies facing 1500+ but -6000 seem to fade as their career progresses. - These goalies tend to be backups, facing ~600-1000 shots a season. - This fade could partly be due to aging effects.
To get a clearer sense of the dynamics described above, let's take the group average pAdjSV% through each shot faced.
Some thoughts: - The effects are much clearer here. - There isn't much to glean from goalies facing -300 shots. - These short NHL careers are almost certainly due to reasons outside their play in the NHL. - Goalies facing -1500 shots fade quickly. They are given a decent look and fail acutely. - Goalies facing -6000 shots start as the best group through the first 1,000 shots, then fade. - This seemingly unintuitive result is likely due to randomness, and, more interestingly, age.
Let's revisit the unintuive plot comparing pAdjSV% over goalie careers, grouped by career length. This time, we'll plot the average age of goalies in each group as they face shots over their career.
Some thoughts: - Goalies facing -6000 shots are ~1.5 years older than 6000+ goalies throughout their career. - This difference obviously includes the span from age 23 to roughly 27. - This is precisely the age range in which goalies seem to be improving in AdjSV%. - We can adjust for this.
To start, we can’t keep every goalie in our population for this analysis. We just don’t know how much experience a goalie had before the 2007-2008 season, so any goalie playing that season has to be removed. The same is true for the goalies playing the 2022-2023 season. As an example, we don’t know how Jeremy Sayman’s career will turn out - we only know what he’s done in his first few seasons, so we can’t properly categorize his career yet. </p>
Here's a short summary of the reduced population: - Goalie population drops from 315 to 140. - Harmonic mean of shots against rises from 12,690 to 14,568 (mean drops, 4,198 to 3,225). - Harmonic mean of AdjSV% stays at .939 (mean drops, .932 to .927). - Mean of career shots faced drops from 4,198 to 3,225. - Mean of AdjSV% drops from .932 to .927.