[Post 1] Measuring the uncertainty caused by the current overtime format
The conventional wisdom on the current 5 minute 3-on-3 overtime format is that its outcome is random. For this post, let's take this at face value (we'll save the skepticism for the next post). The consequence is that, after regulation time, the team's essentially flip a coin to determine the winner. If a given team happens to get lucky and land a bunch of heads, it gets more points than another team who happened to land a bunch of tails. This added randomness is a problem - it causes uncertainty in the final standing points, which could have an effect on the final rankings and, importantly, if a team makes the playoffs or not - or a team's chance at winning the draft lottery.
But how much uncertainty does the current playoff format add?
To measure this, we'll create a conference of synthetic teams. Teams are created by taking the average regulation points percentage of their conference rank from 2015-2020, like this:
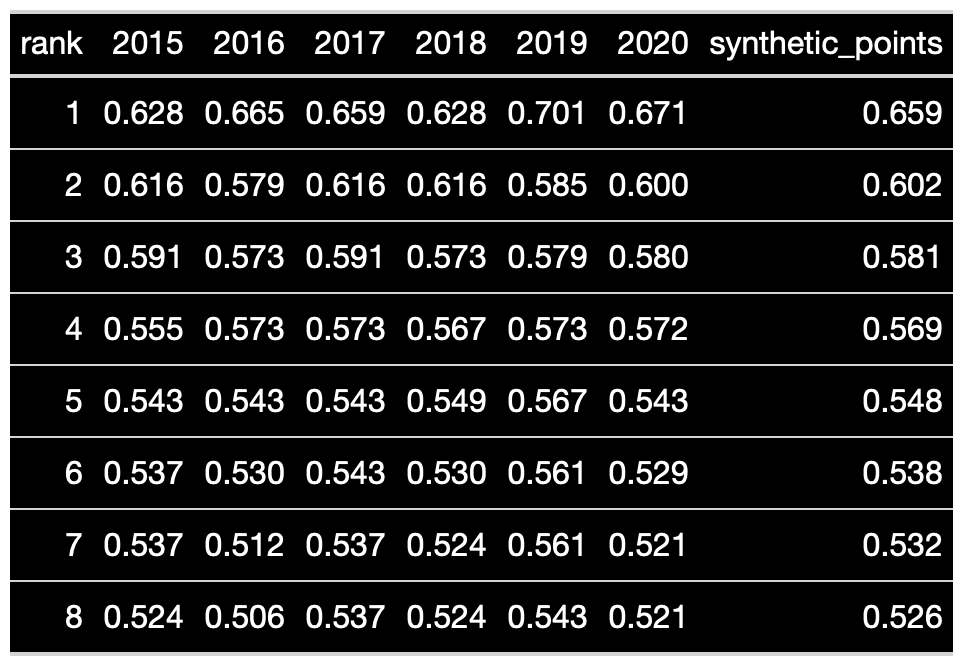
Now we assign the average number of overtime games (23%, or about 19, regardless of team ranking) to each team, and flip coins by way of the binomial to determine the number of overtime points won for each team.
A team can expect to stray from their expected standing points by about 1.76 points. On average, the largest swings (both positive and negative) are about 4.4 standing points.
For context, we can simulate seasons using: 1) the conference of synthetic teams, after converting their regulation point percentage to point totals and 2) coin flips to determine overtime winners. With this, we can see in what percentage of seasons a team who would have made the playoffs with their regulation points misses with the extra overtime point (about 44%), as well as the average number of ranking changes which occur in a given year due to the overtime point (about 5.5).