[Post 1] Post-regulation: How important is it?
Since 2015, when a game is tied after 60 minutes of play, both teams are awarded one standing point along with the opportunity for a second point in the overtime. Most of the rules from regulation carry over, except for a few important ones - the play goes from 5 players aside to 3, and the period lasts only 5 minutes (compared to 20 in regulation). The format change is geared towards increasing entertainment in the form of chaos - the ice surface is too large and the players are too fast and too skilled to prevent chances.
This series of posts will attempt to address the effects of this change in playing format, by answering questions like: Does a team's regular season success translate to overtime success? Is a given game's regulation play an indicator for its overtime play? Does a team's play in overtime before a goal is scored indicate who is more likely win? Can we predict who will get the next shot? Is the chaos created by the playing format change an equalizer of sorts?
To finish the introduction, let's look at how many overtime games a team can expect to play in a given year using data from 2015-2019 (this overtime format was introduced in 2015 and 2020 was an incomplete year).
Pre-Overtime Standing Points Per Game vs % of Games going to Overtime
There isn’t much of a relationship between a team’s regular season performance and the number of times they make it to overtime. You might have thought - like me - that average teams tend to have more overtime appearances because they’re more closely skilled with the rest of the league than exceedingly strong/weak teams, but no, there isn’t much there*. Let’s assume going forward in this series that the number of OT appearances of a given team is random and centered around 23%.
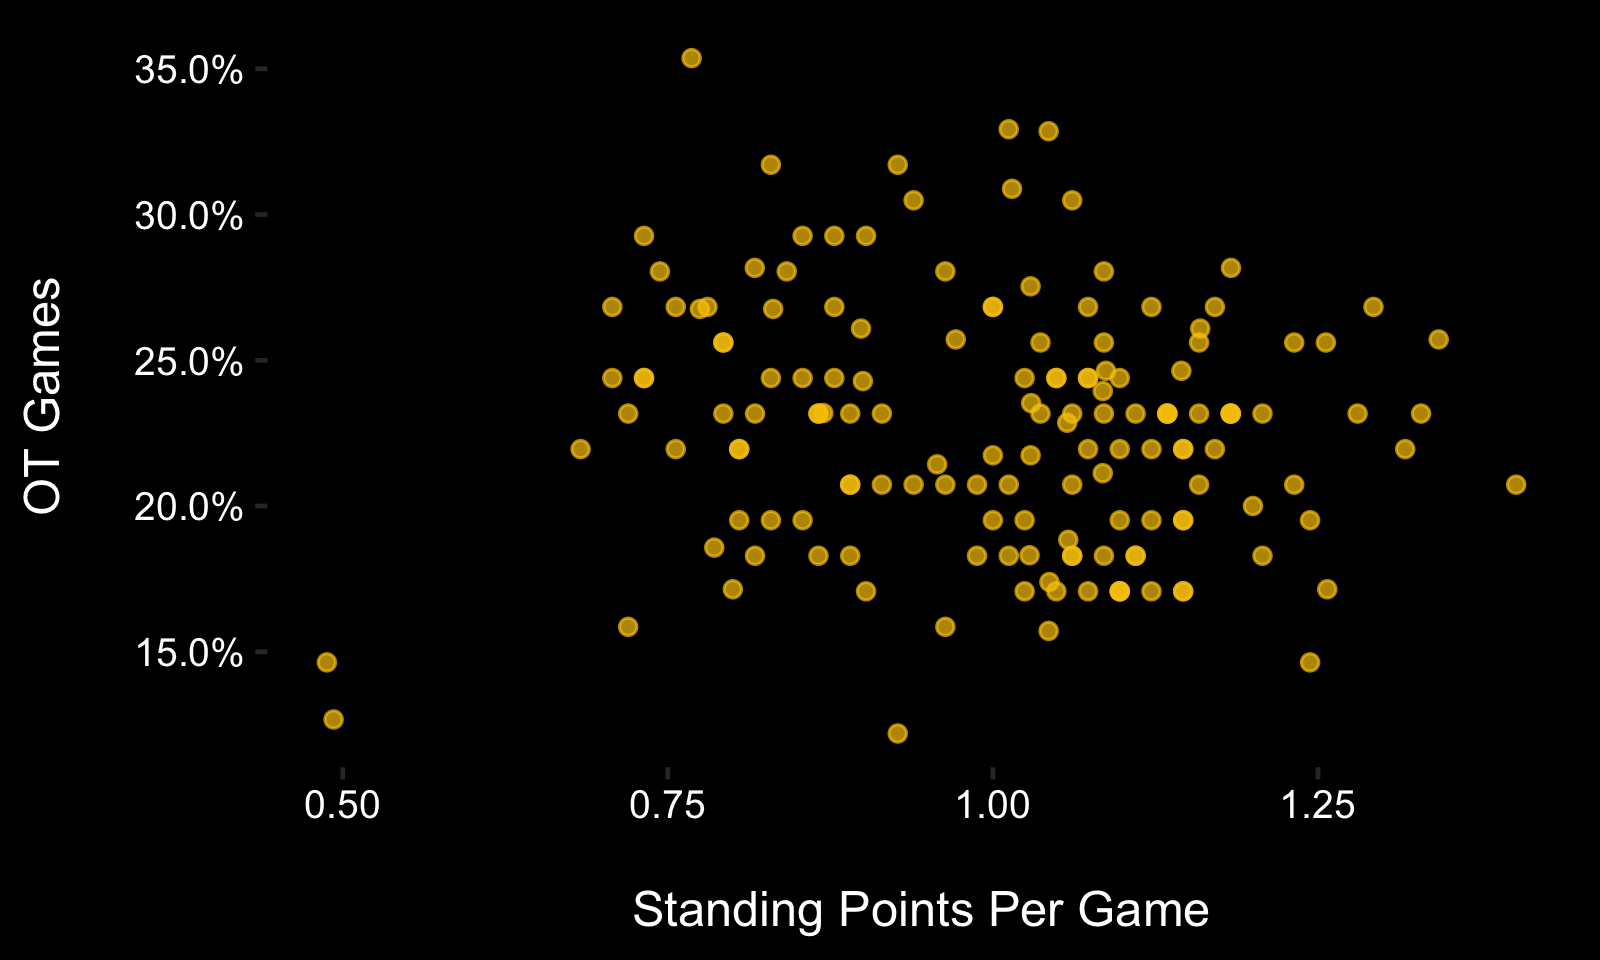
*Technically, you could make the case to drop the few historically bad teams as outliers, in which case there would be a slight but statistically significant decrease in overtime games as a team's standing performance increased, which would amount to roughly a 2.5% (about 2 games) difference in overtime games per season between the worst and best teams, but this is moving away from the spirit of the analysis and will be ignored.