Post-regulation
Note / Hockey
5 min read
Since 2015, a game tied after 60 minutes gives both teams one standing point and a five-minute, three-on-three period for a second. Most of the rules from regulation carry over, except for a few important ones: the play goes from five players aside to three, and the period lasts only five minutes. The format change is geared towards increasing entertainment in the form of chaos—the ice surface is too large, and the players are too fast and too skilled, to prevent chances.
Is the chaos an equalizer? Does a team’s regular-season success translate to overtime? Is a given game’s regulation play an indicator for its overtime play? And once overtime begins, does the sequence of play tell us who is more likely to win?
How often does a team reach overtime?
There isn’t much of a relationship between a team’s regulation performance and the number of times it makes it to overtime. You might expect average teams to have more overtime appearances because they are more closely matched with the rest of the league than exceedingly strong or weak teams, but there isn’t much there.
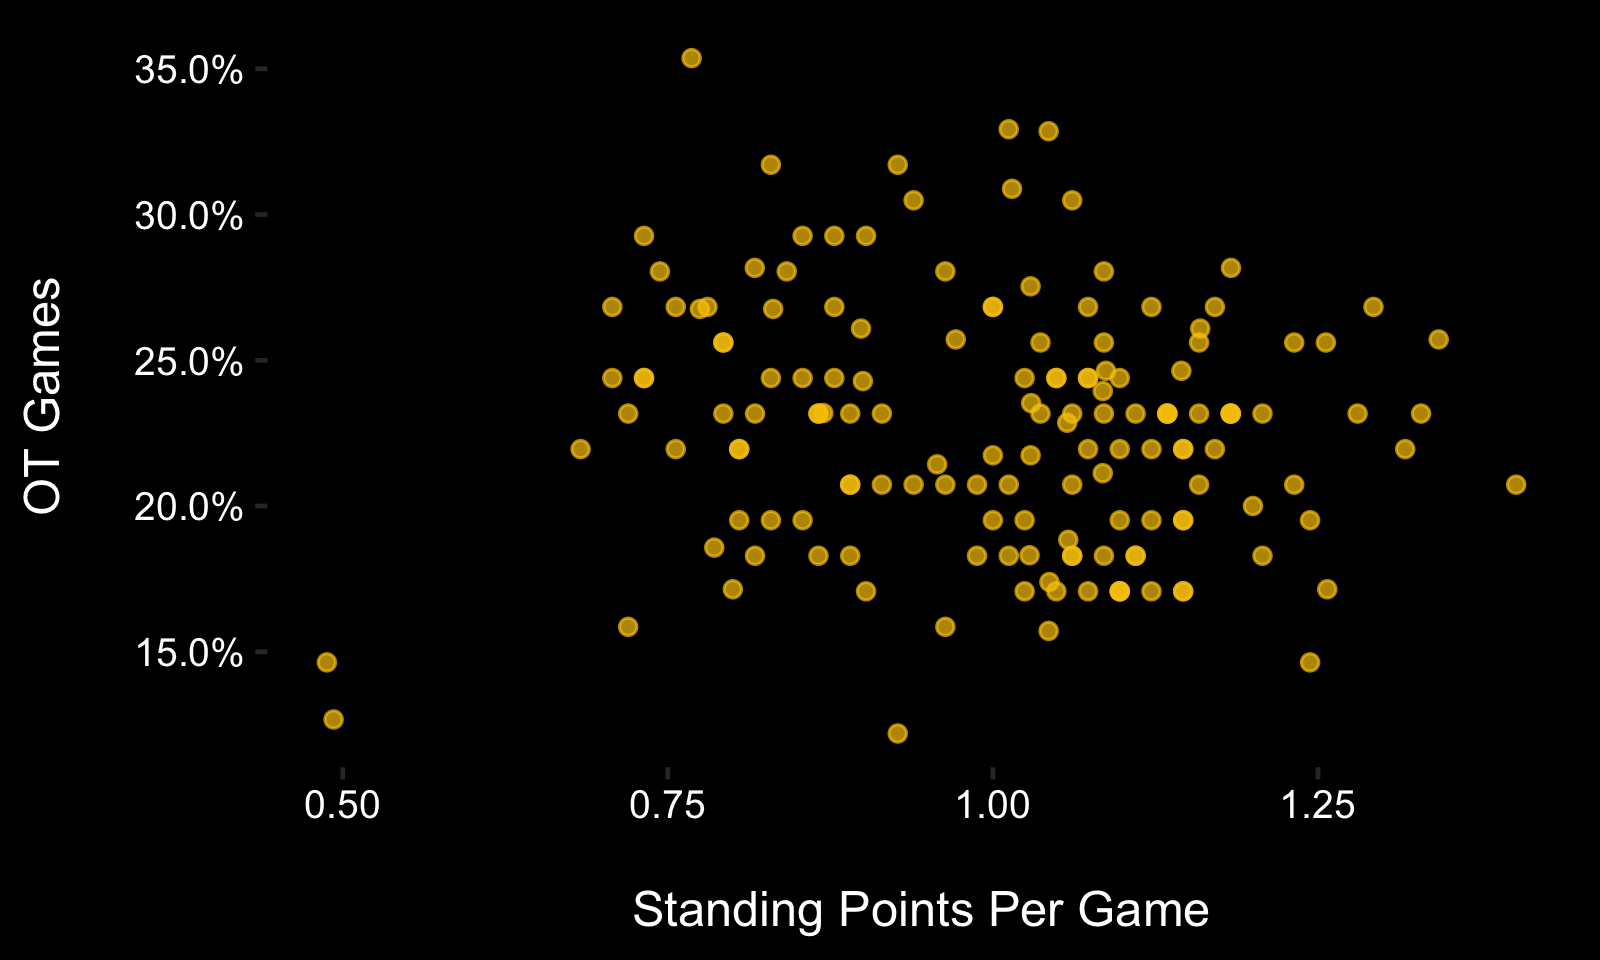
Dropping a few historically bad teams as outliers produces a slight decline in overtime appearances as team strength rises. It amounts to roughly two games over a full season between the weakest and strongest teams—not enough to change the spirit of the result. Going forward, the number of overtime appearances can be treated as random and centred around 23% of a team’s games.
How much uncertainty does that create?
The conventional wisdom is that the outcome of three-on-three overtime is random. Take that at face value for a moment. After regulation, the teams essentially flip a coin to determine who receives the second point. A team which lands a few more heads receives more standing points than one which lands a few more tails.
To measure the effect, create a conference of synthetic teams using the average regulation points percentage at each conference rank from 2015–20:
SYNTHETIC CONFERENCE
| Rank | 2015 | 2016 | 2017 | 2018 | 2019 | 2020 | Mean |
|---|---|---|---|---|---|---|---|
| 1 | .628 | .665 | .659 | .628 | .701 | .671 | .659 |
| 2 | .616 | .579 | .616 | .616 | .585 | .600 | .602 |
| 3 | .591 | .573 | .591 | .573 | .579 | .580 | .581 |
| 4 | .555 | .573 | .573 | .567 | .573 | .572 | .569 |
| 5 | .543 | .543 | .543 | .549 | .567 | .543 | .548 |
| 6 | .537 | .530 | .543 | .530 | .561 | .529 | .538 |
| 7 | .537 | .512 | .537 | .524 | .561 | .521 | .532 |
| 8 | .524 | .506 | .537 | .524 | .543 | .521 | .526 |
Assign each team the average number of overtime games—about 19—and flip coins by way of the binomial distribution to determine the number of overtime points it wins.
A team strays from its expected standing total by about 1.76 points on average. The largest positive and negative swings in a season average about 4.4 points. Across simulated seasons, a team which would have qualified on regulation points alone misses the playoffs after overtime points are added about 44% of the time. Around 5.5 conference positions change per season.
This doesn’t mean overtime is bad. It means the format adds a measurable layer of uncertainty to standings which are often decided by one or two points.
Is overtime completely random?
At the season level, regulation points percentage does not predict overtime points percentage:
REGULATION VS. OVERTIME PERFORMANCE
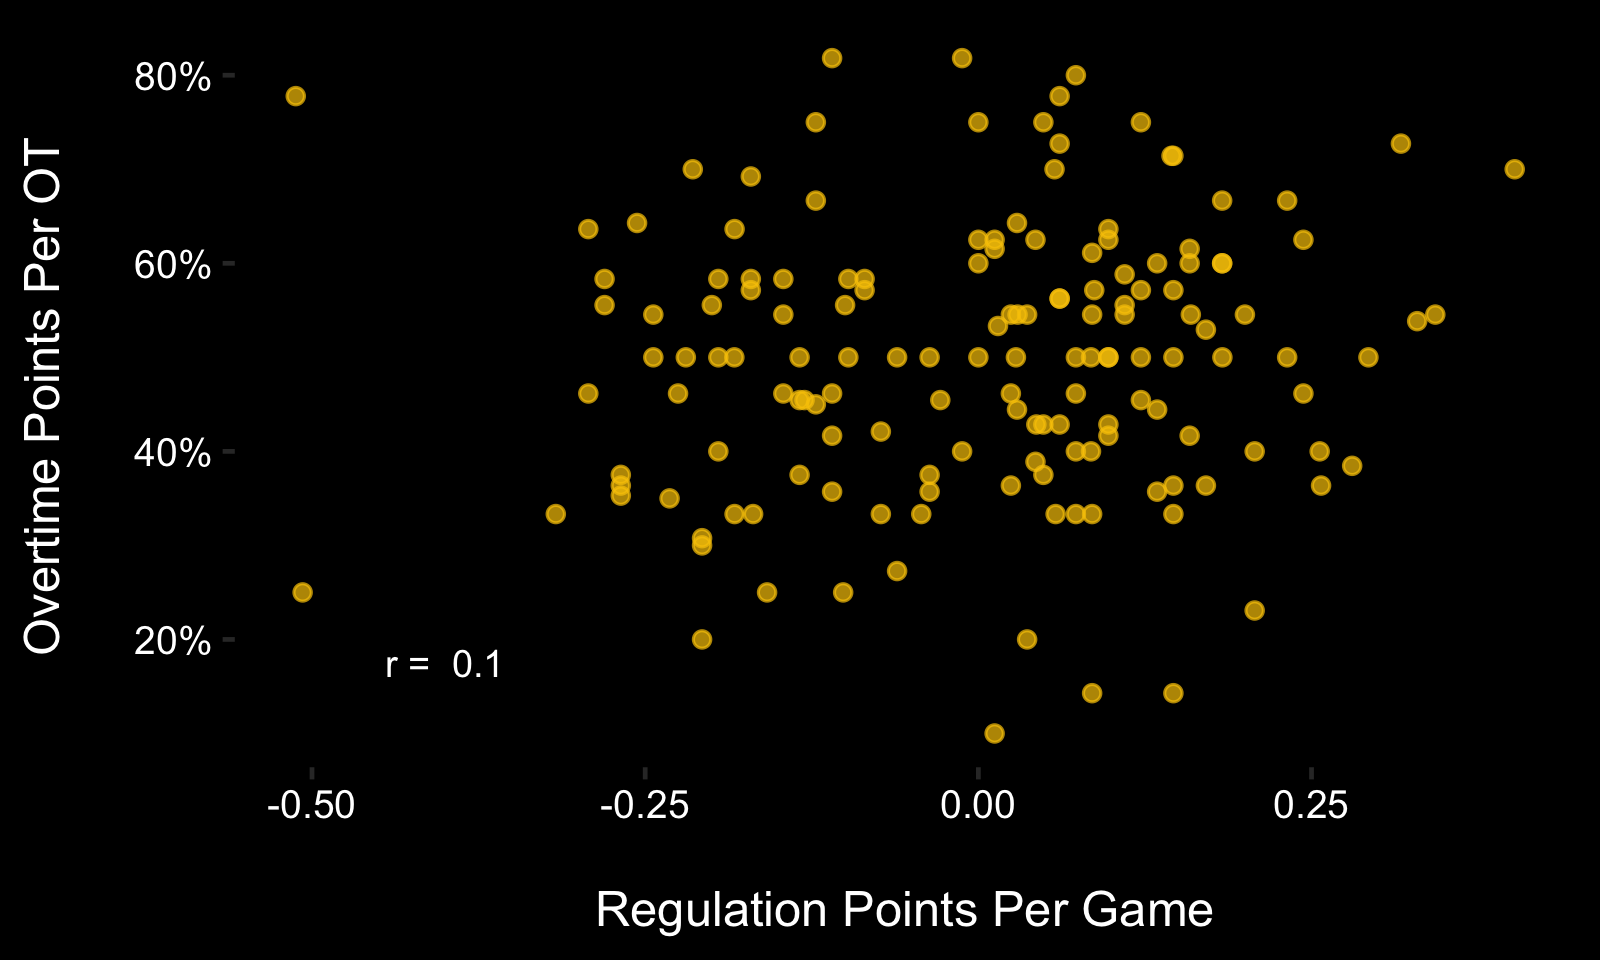
There’s nothing there. You don’t need a regression to see that.
Another way to look at this is to regress season-long expected-goal share and regulation expected-goal share on the outcome of individual games which reach overtime. But it is the same result—there’s nothing there.
PRE-OVERTIME MODEL
| Term | Estimate | p value |
|---|---|---|
| Intercept | .075 | .240 |
| Home ice | −.150 | .102 |
| Regulation xG%, game | .004 | .344 |
| Regulation xG%, season | .020 | .207 |
The insignificance is useful. What happens before overtime tells us surprisingly little about who will win it.
What matters once overtime begins?
The next question is whether overtime remains random during the overtime. Using every game ending in overtime from the format’s introduction through the study period, regress the outcome on a team’s season-long expected-goal share, its regulation and overtime expected-goal shares in that game, and whether it took the final shot before the winning goal. Think of the first three predictors as controls. A few examples of what an observation looks like:
EXAMPLE OBSERVATIONS
| Season | Game | Team | Won | Last shot | OT xG± | Reg. xG± | Season xG± |
|---|---|---|---|---|---|---|---|
| 2020 | 20003 | TOR | 1 | −1 | 13.1 | −2.0 | 6.2 |
| 2020 | 20003 | MTL | 0 | 1 | −13.1 | 2.0 | −0.7 |
| 2020 | 20012 | WPG | 1 | 1 | 50.0 | 7.8 | −3.0 |
| 2020 | 20012 | CGY | 0 | −1 | −50.0 | −7.8 | 1.9 |
| 2020 | 20016 | L.A | 0 | 1 | −1.3 | 17.6 | −5.0 |
| 2020 | 20016 | MIN | 1 | −1 | 1.3 | −17.6 | 1.7 |
The model can be summarized like this:
OVERTIME MODEL
| Term | Estimate | p value |
|---|---|---|
| Intercept | .000 | .998 |
| Overtime xG%, game | .004 | .029 |
| Regulation xG%, game | .001 | .904 |
| Regulation xG%, season | .021 | .176 |
| Last shot | .244 | <.001 |
Having taken the previous shot matters. It adds about 13.8 percentage points to a team’s win probability, bringing it to 63.8%.
The only other relevant predictor is the team’s expected-goal share in overtime before the goal was scored. It is a distant second: a ten-point increase adds about 1.9 percentage points. Even a team controlling 75% of overtime expected goals reaches only a 54.7% win probability. Season strength and regulation play do not factor.
Are all shots equal?
Not in this model. The final shot may stand in for possession, territorial control, rebound pressure, or the quality of the transition it creates. The next version should update win probability after every event and use shot quality and game state, rather than only asking which team shot most recently.
The useful split is this: before overtime, team quality tells us almost nothing about who will win. Once overtime begins, the sequence of play starts to matter. Its predictive information is local and fleeting rather than a stable property of the teams.